Beyond Financial Statements - Extra Available Panels
Finance BI not only allows for analysis of the Balance Sheet and P&L Statement, but also covers other key areas to provide a comprehensive view of the business's financial health.
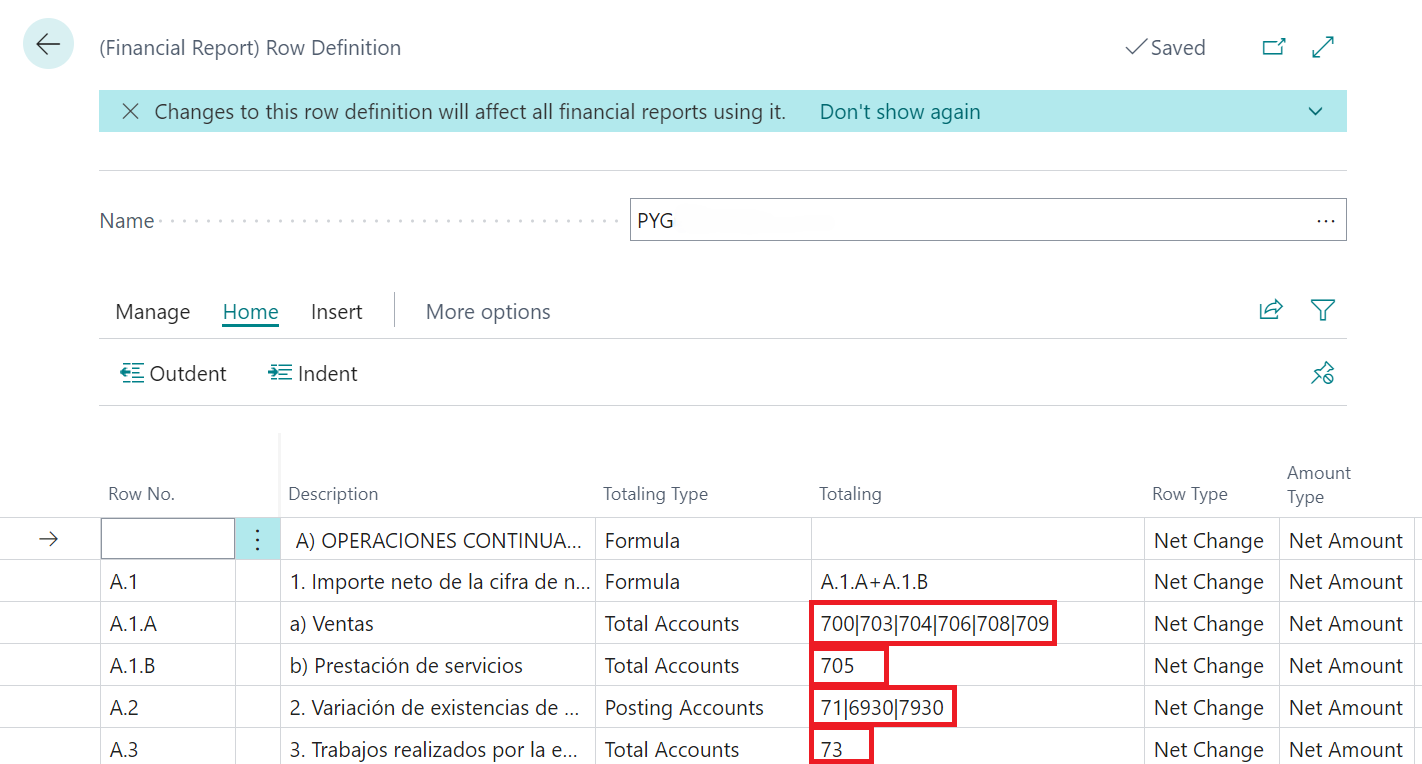
Accounts Outside the Scheme
This page ensures that all critical information is included in the dashboard. If there are new accounts with transactions that don't fit into the established schemes, they are still represented in the dashboard. This feature helps to identify which scheme these accounts should belong to, ensuring a complete analysis of all accounts.
By including auxiliary accounts, it provides detailed and accurate recording and classification of every financial transaction, leading to a better understanding of the financial situation.
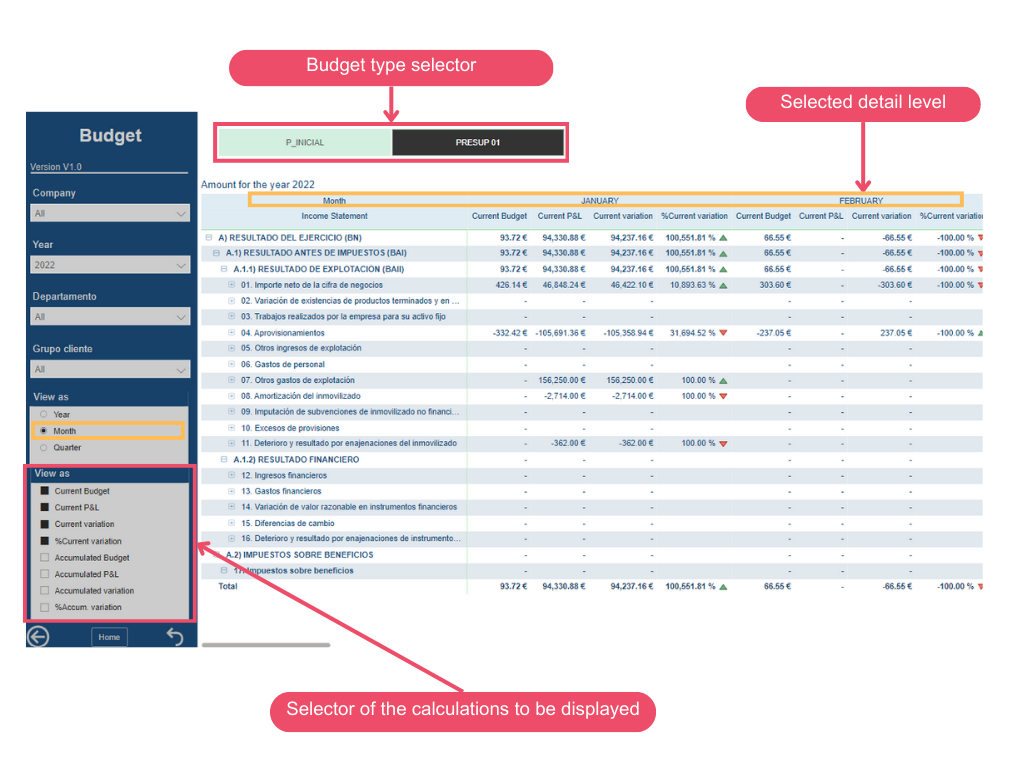
Budget
This page allows users to monitor everything related to the budget. Users can filter by time periods, desired dimension values, companies, or specific measures they want to observe.
This feature enables viewing of the current budget, cumulative totals, or percentage variations at different levels of detail. Users can also choose which type of budget to analyze, depending on the data available for each selected month.
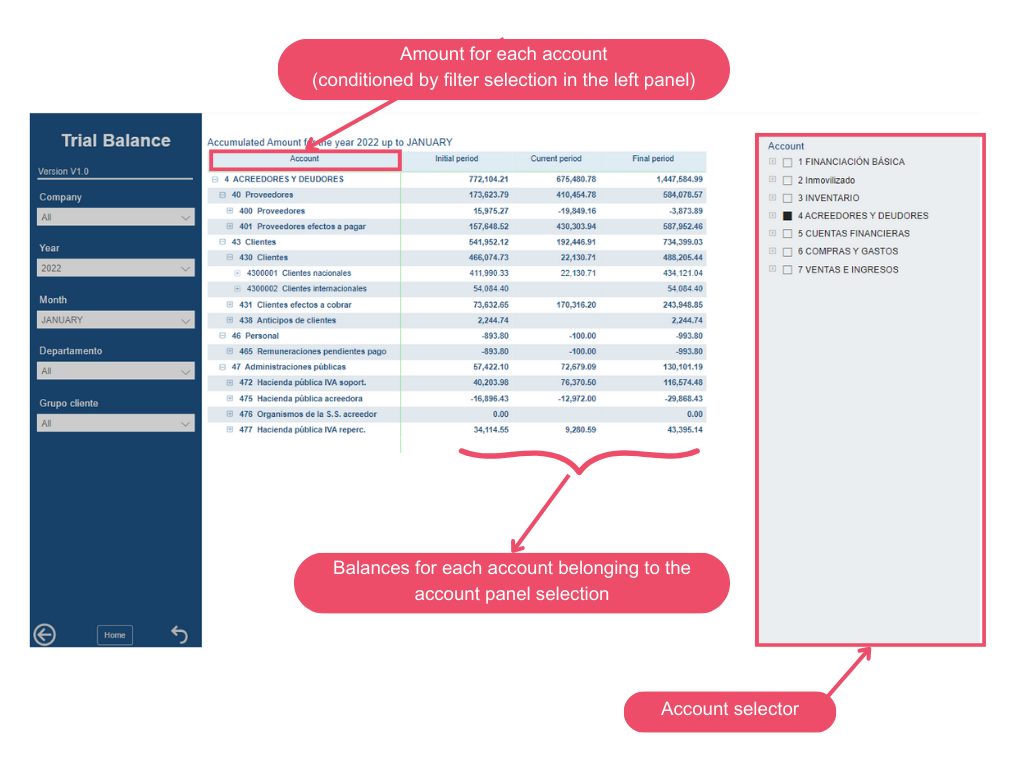
Trial Balance
The trial balance report shows the debit and credit positions of a company, validating the reliability of all balances used during the financial period. It helps to correct the general ledger and ensure there are no errors in the journal entries.
Our solution allows filtering of accounts using the slicer on the right side, enabling users to view only the desired data. Additional filters are available on the left panel, including dimensions, companies, and time filters.
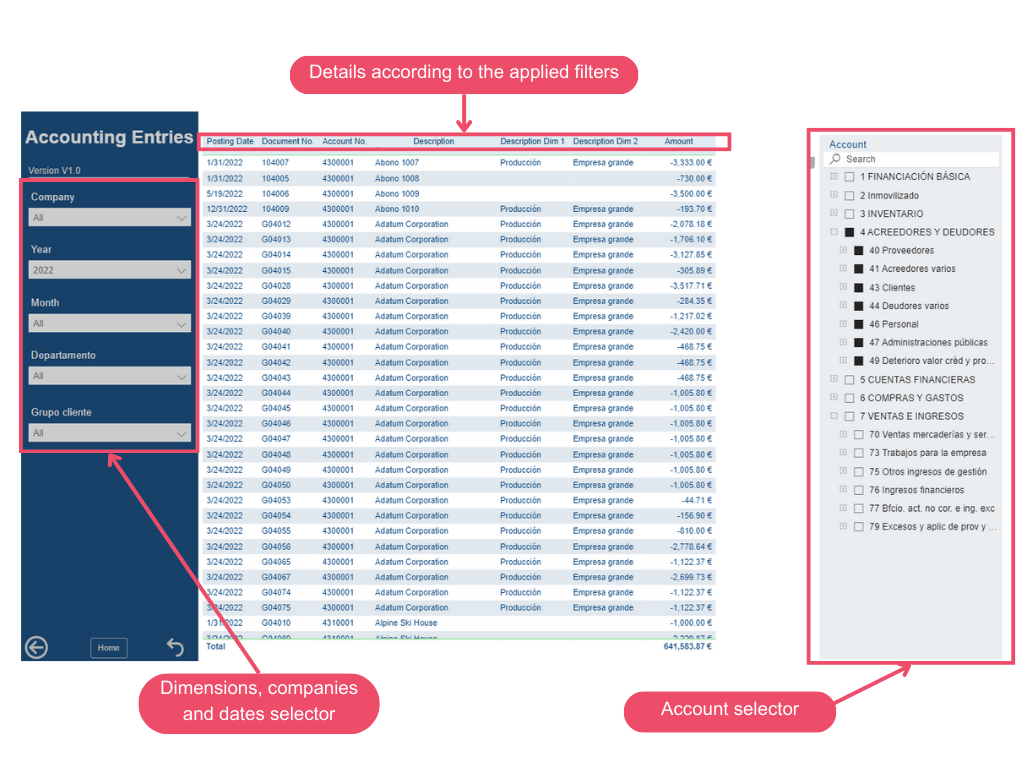
Accounting Entries
Having a detailed page for accounting entries ensures greater accuracy of financial statements, as these entries form the financial reports. For example:
- Assets, liabilities, and equity in the balance sheet come directly from the accumulated ledger entries.
- Income and expenses recorded in the entries are summarized to calculate the net profit or loss presented in the P&L Statement.
In summary, all financial transactions are initially recorded as journal entries in the accounting books. Having detailed information on these entries helps understand the origins of the amounts in the financial statements, aids in informed decision-making, and identifies potential errors or areas needing attention.
This page, like the Trial Balance, allows filtering of accounts and options available in the left panel. Users can customize the view based on their analysis needs, displaying data such as the recording date, description, and amount, among other details.
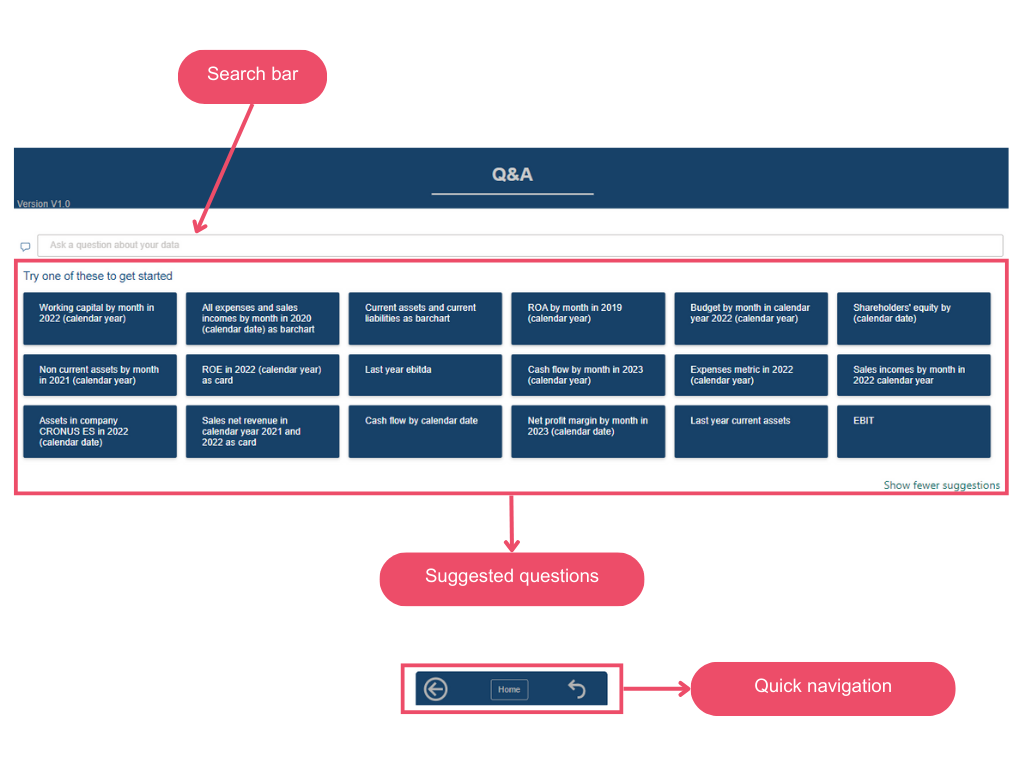
Questions and Answers - Q&A
Finance BI introduces an innovative solution to provide quick answers to potential questions using Artificial Intelligence (AI). It integrates a Q&A feature that suggests relevant questions of interest.
Additionally, thanks to the capabilities of AI, users can ask their own questions, allowing the application to quickly provide the answers they seek.
Finance BI offers 18 suggested questions, allowing users to access relevant visualizations and insights with just a click.
Currently, this feature only allows questions to be asked in English. If you want to ask a question other than the suggested ones, you'll need to do so in this language.
Anomalies and Predictions - Balance Sheet
Finance BI integrates artificial intelligence into its dashboard, offering visuals that go beyond, incorporating predictions and anomaly detection in the data.
To access this page, the Enable AI Visuals option in the Power BI connector (configured within Business Central) must be enabled. Once activated, from the Balance Statistics page, the user can press the Anomalies and Predictions button to access the respective page.
This page contains, on one hand, a chart that shows the anomalies detected for the accumulated balance amount. In this chart, in addition to a dashed trend line, a gray area will mark the range of possible expected values. Thus, when a value is obtained above or below this range, it will be considered an anomaly. It should also be noted that a 90% confidence level has been pre-established, so the system will look for anomalies that fall outside this 90% confidence interval for the expected value.
On the other hand, at the bottom of the chart, there is a prediction chart for the monthly accumulated balance. This visual allows for the analysis of how the accumulated amount may evolve over the next six months using prediction algorithms.
The projections are based on patterns of trend, seasonality, and variations in historical data. By hovering over any future point, the prediction along with the upper and lower limits, according to the confidence interval, will be displayed. In this case, a 95% confidence interval has been established, meaning that if the prediction were repeated, in 95% of cases, the interval would contain the true value.
Additionally, a text box is also displayed, including a narrative that quickly detects the maximum and minimum values of the accumulated amount, along with the date associated with each value.

Anomalies and Predictions - P&L
Similarly to the Anomalies and Predictions page for the balance, there is a predictions and anomalies page dedicated to the analysis of KPIs derived from the Profit and Loss Statement.
In this regard, depending on the KPI selected by the user on the P&L Statistics page, pressing the Anomalies and Predictions button will lead the user to this page to analyze the six-month prediction of the selected KPI value and the corresponding anomaly detection.
At the top is the anomaly detection chart, very similar to the anomaly detection chart already explained for the balance. However, in this case, the selected confidence level is 80%, so the system will look for anomalies that fall outside this confidence interval for the expected value.
As for the prediction chart, it is also set for six months, with a 95% confidence interval.

Hierarchical Scheme - P&L
Following the visuals incorporated thanks to the AI visuals enabling functionality, a hierarchical scheme is also included, allowing the analysis of the P&L amount through different dimensions, as well as categories and sections.