Financial Statements
Finance BI focuses on analyzing two financial statements: the Profits and Loss Statement and the Balance Sheet. For each of these, a comprehensive analysis is carried out using the same approach, while also adapting to their specific characteristics.
Profits and Loss Statement - P&L
Profit and Loss Statement is a financial report that details a company's revenues and expenses, showing the net profit for a specific period. This financial tool is important because:
- It allows for the evaluation of business profitability by showing net gains.
- It supports decision-making by identifying areas for improvement with high costs and/or low revenues.
- It provides the ability to analyze trends in revenues and expenses.
Finance BI goes beyond the traditional view, offering users quick insights into key ratios and detailed information through various analysis perspectives.
Overview
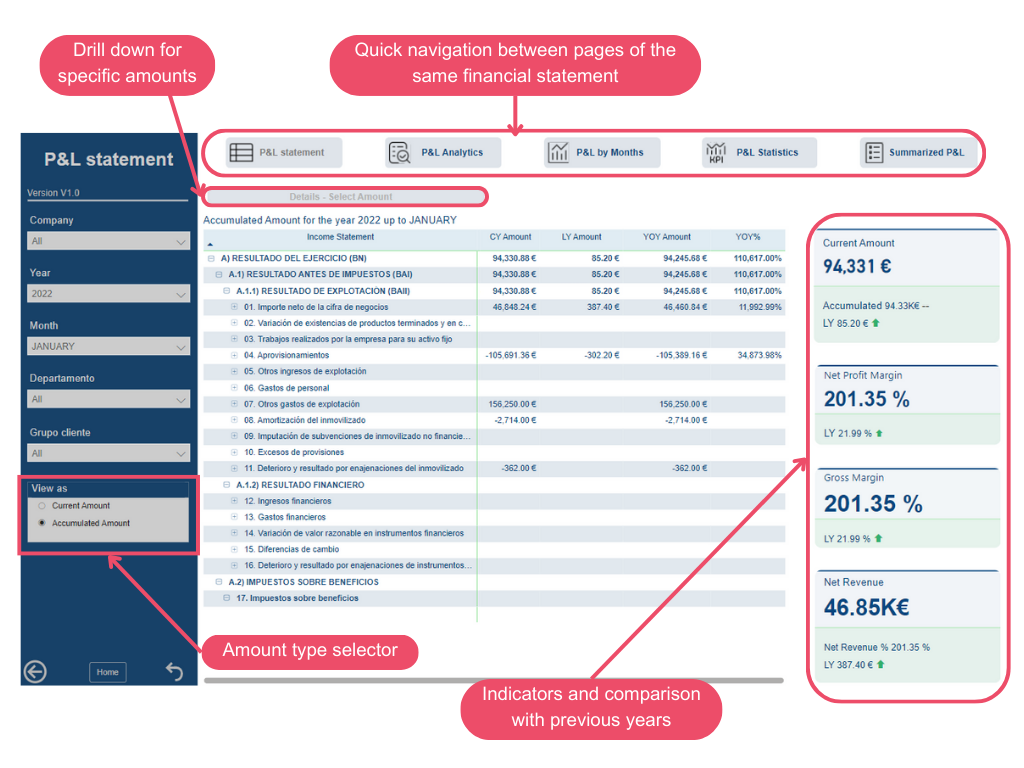
The overview gives a quick glance at the results for the period, including pre-tax profit (EBT), operating profit (EBIT), financial result, and more. It also compares these values to those of the previous year, quickly and intuitively.
P&L Analytics
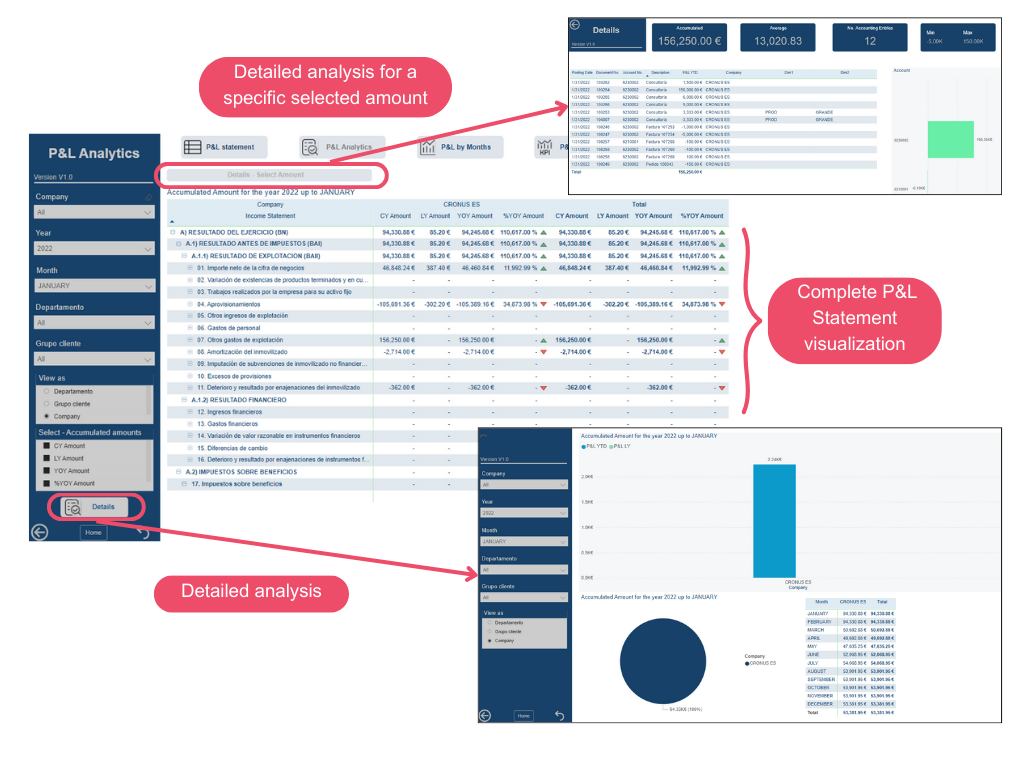
The analysis of the Profits and Loss Statement allows for a complete visualization of this financial statement, comparing current amounts to those of previous years. Beyond the details for specific amounts, users can gain deeper insights through breakdowns and comparisons.
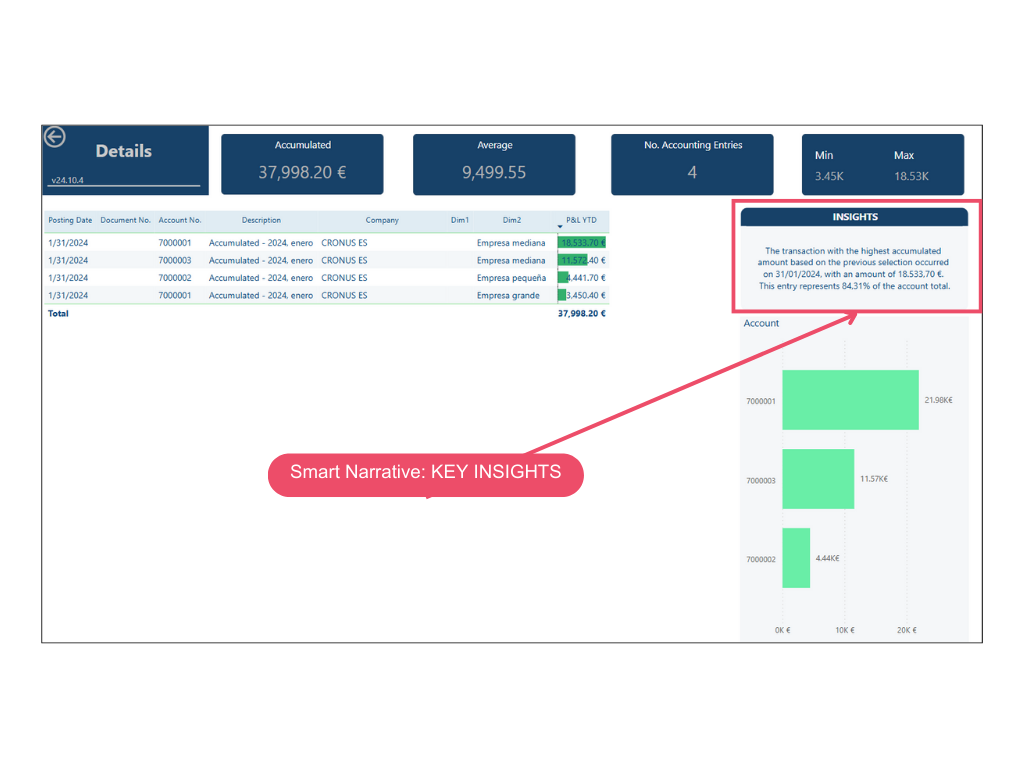
Additionally, if the functionality Enable AI Visuals is activated, the Selected Amount Details page will feature intelligent narrative, allowing the detection of the highest amount movement based on the selection, along with other relevant data:
P&L by Months
Users can break down P&L on a monthly basis, quickly identifying when each amount originated and accessing detailed information for each specific amount.
Additionally, it is possible to access detailed monthly analyses that display indicators on a monthly basis, allowing users to track the evolution of each calculation.
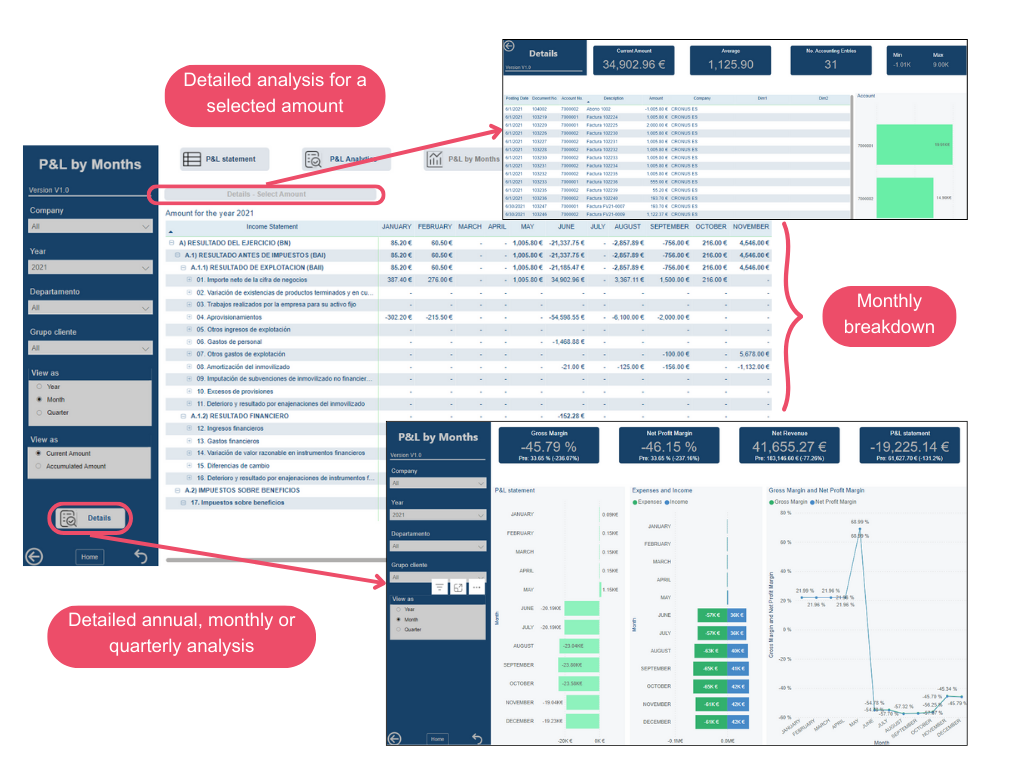
Similarly to the previous page, depending on whether the AI functionality is enabled, key insights will be displayed or not.
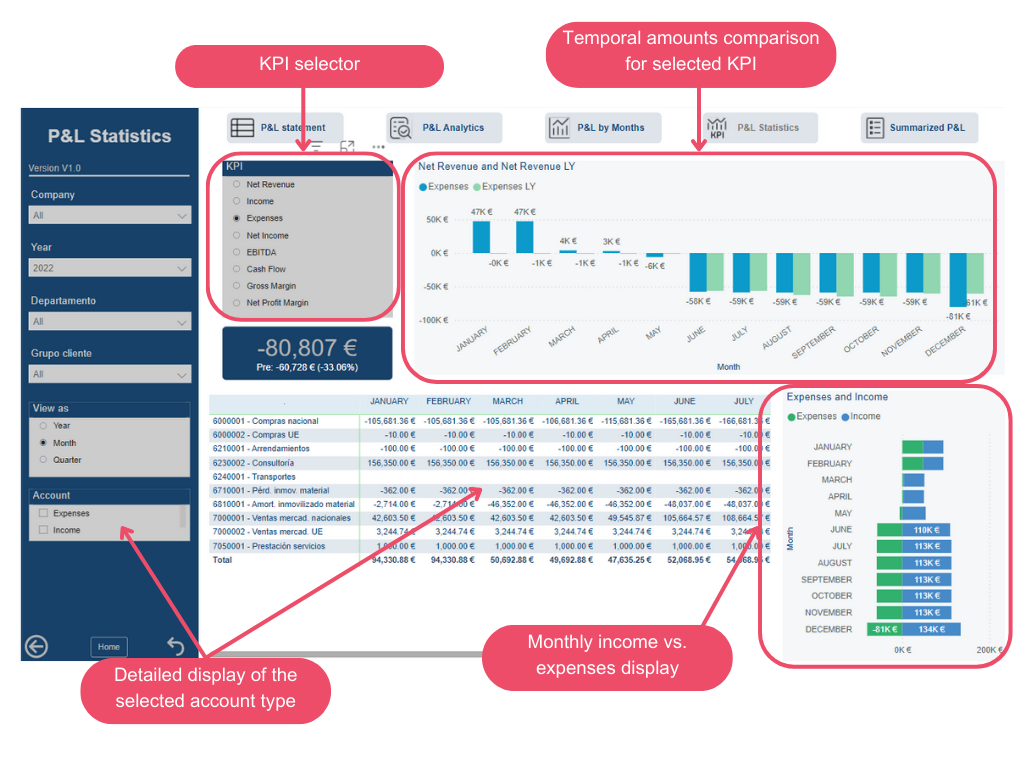
P&L Statistics
This page allows users to quickly analyze the most important KPIs, enabling temporal comparisons of their values.
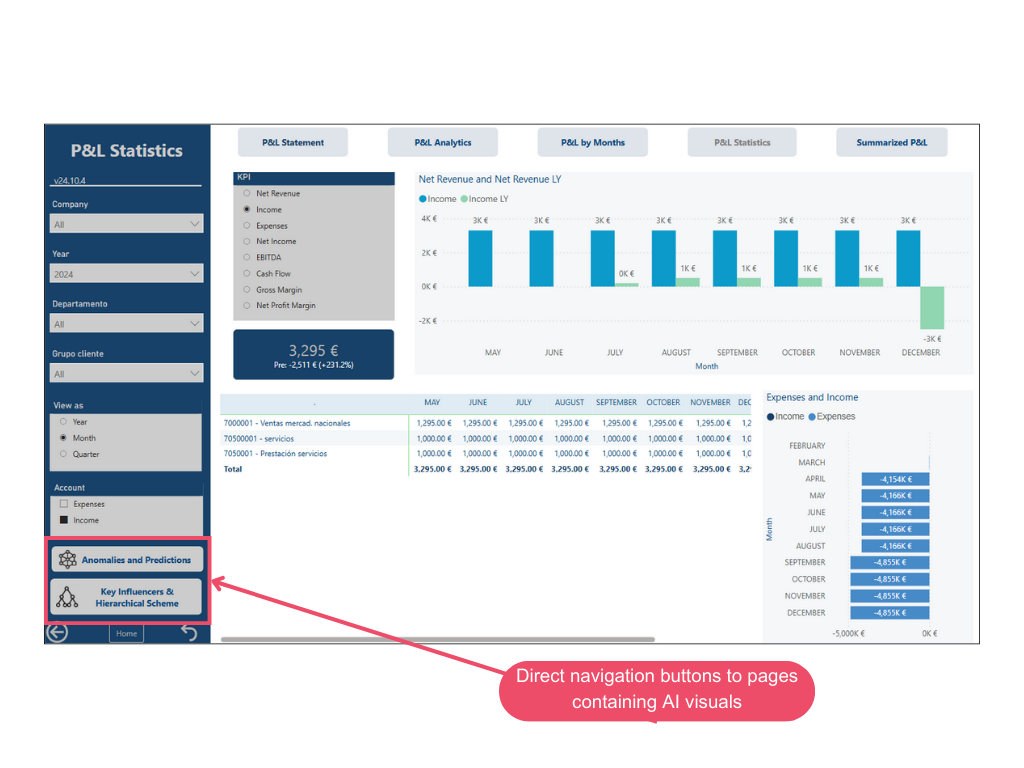
If you have the AI-enabled version, this page will display two buttons that allow navigation to specific pages incorporating artificial intelligence visuals:
- Button 1: Anomalies and Predictions.
- Button 2: Key influencers and Hierarchical Scheme.
P&L Summary
The summary compiles the most important aspects of the analysis, providing users with a comprehensive view of the financial state. It can also serve as a starting point for identifying areas that need further analysis
Balance Sheet - BS
The Balance Sheet is a financial statement that provides a snapshot of a company's economic and financial information at a specific moment, divided into three categories: assets, liabilities, and equity.
The balance sheet makes it possible to evaluate the company's liquidity, asset value, and debts, both short-term and long-term.
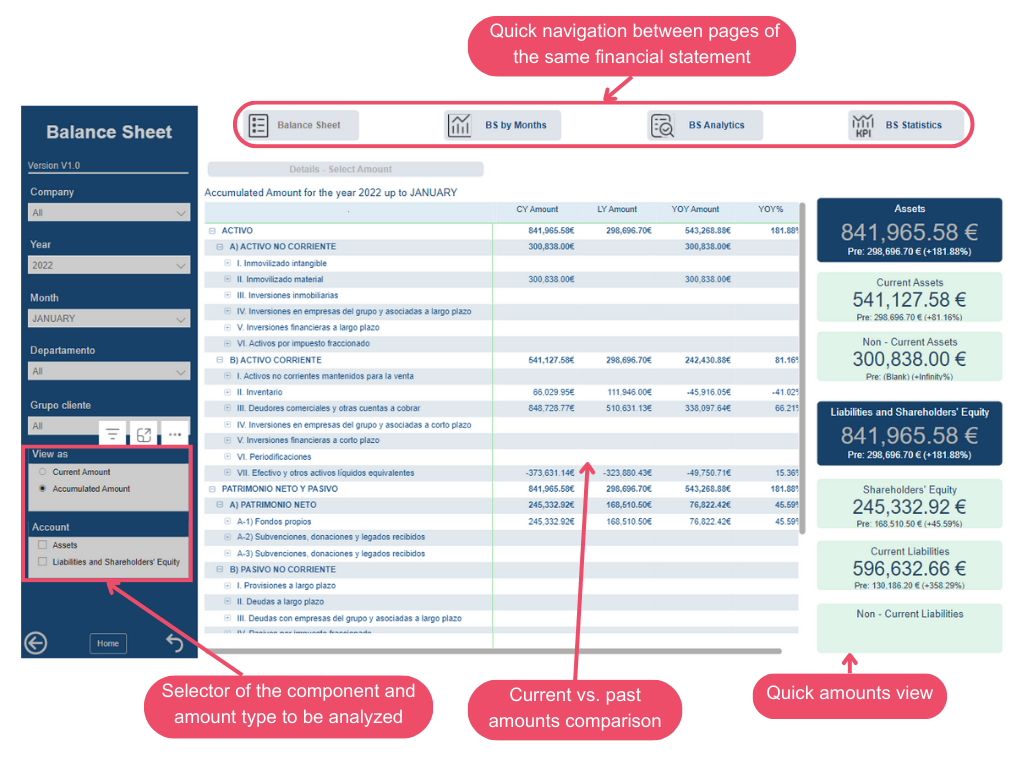
Overview
The overview starts with the balance sheet structure, detailing each of the asset, liability, and equity categories. Users can select the information they want to see in detail and quickly view the amounts for assets, liabilities, and equity.
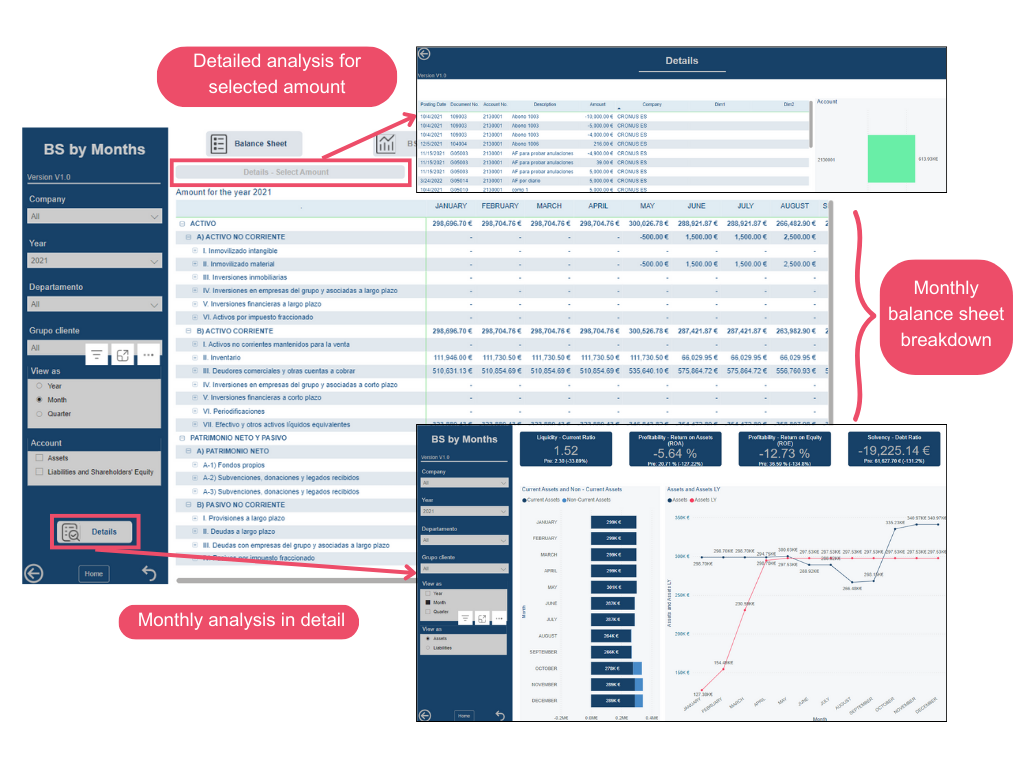
Balance Sheet by Months
This page allows users to view the balance sheet broken down by months (or quarters), enabling them to locate amounts over time.
In addition to detailed amounts, users can also access a detailed monthly balance sheet that provides specific financial ratios and comparisons between current and previous years' amounts.
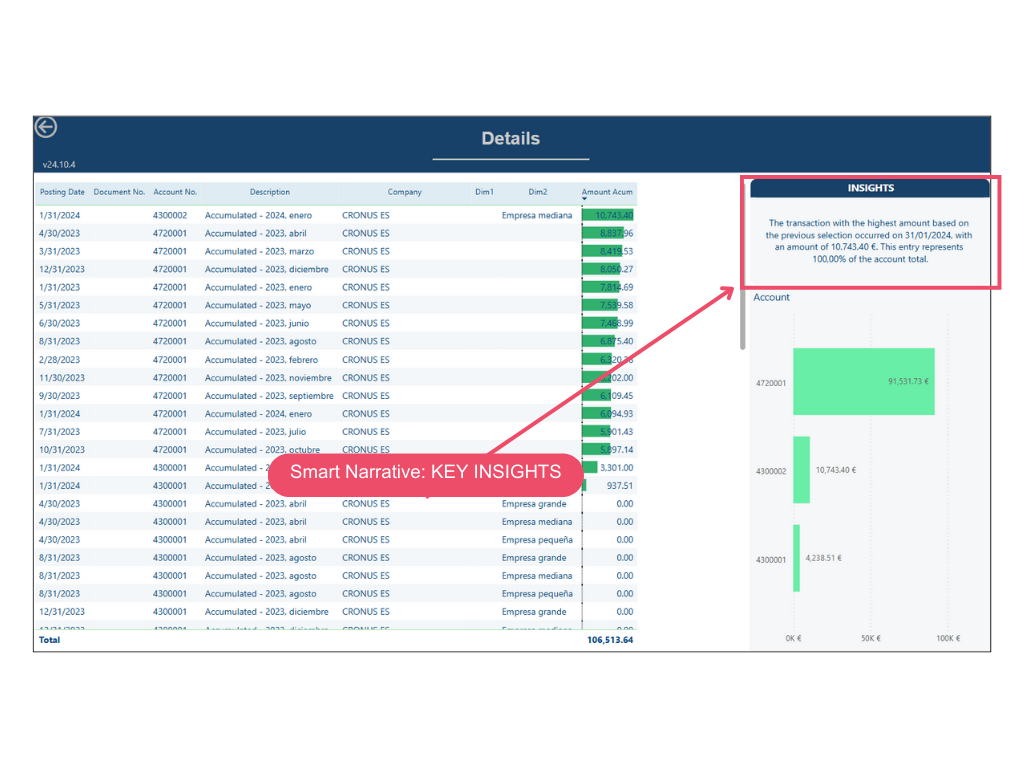
In this case, it is possible to access a detail that incorporates key insights if the AI functionality of the connector is enabled. This way, the user will be able to see an intelligent narrative featuring the most representative movement and related information.
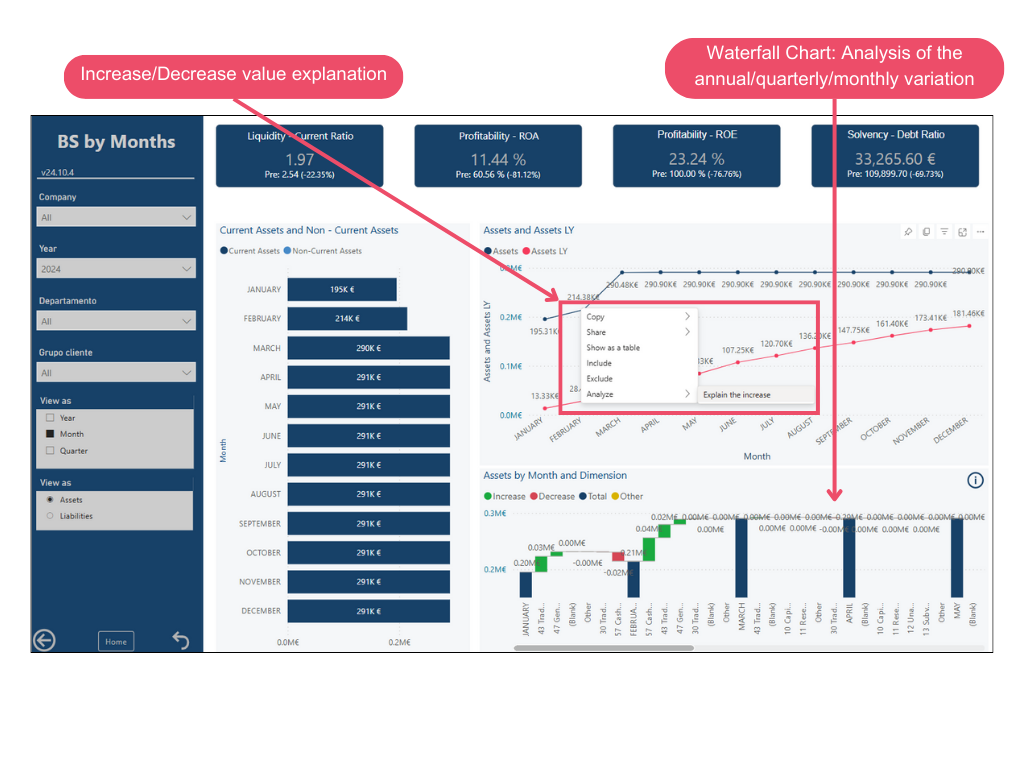
Additionally, in charts with a continuous x-axis (such as the visual located on the right side of the Balance by Months details page), it is possible to click on one of the data points and have Power BI display different reasons explaining why the value increases or decreases compared to the next point. This functionality is accompanied by explanatory charts that help better understand the variations. However, Power BI does not always find valid explanations.
As a reinforcement, in case Power BI does not find a direct explanation, the AI functionality integrates a waterfall chart below the line chart on the Balance by Months detail page, which allows for the analysis of amount variations by dimension. This way, if the value of one month and the next is selected in the upper chart, the variation explained by accounts will appear in the chart below.
Balance Sheet Analytics
The balance sheet analysis allows users to view balance sheet information based on their chosen dimension, selecting the type of amount or date of interest.
For more information, users can access the Details tab to view accumulated amounts of assets for the selected date.
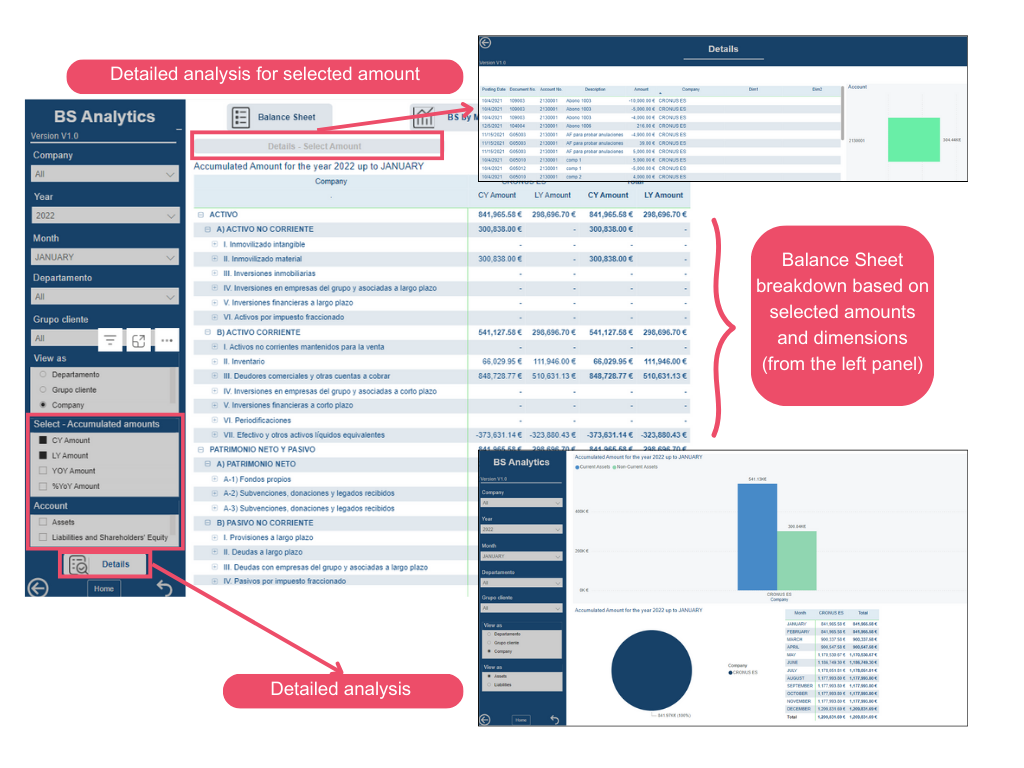
In this case, the AI-enabled version also includes the analysis of key insights on the details page for the selected amount.
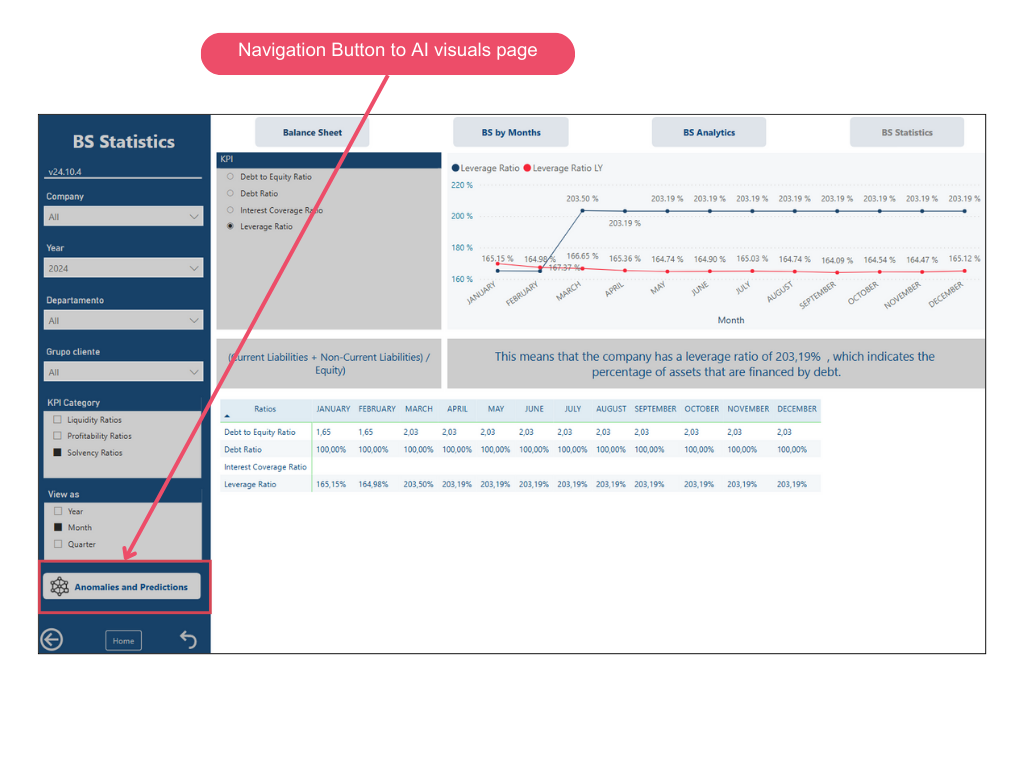
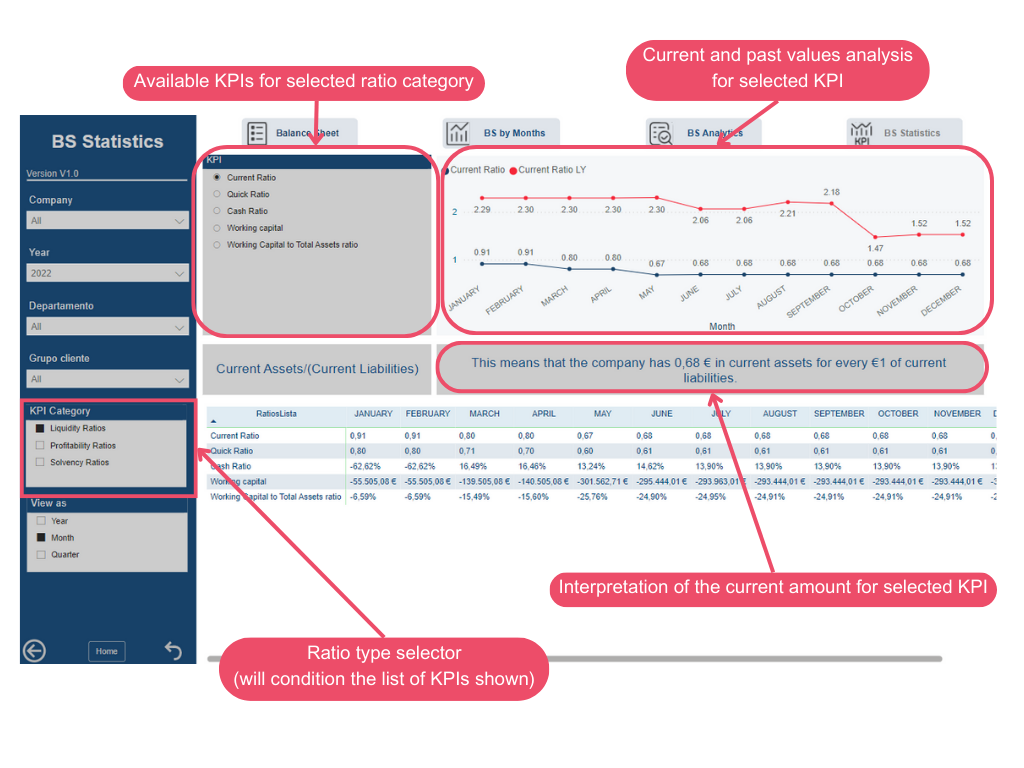
Balance Sheet Statistics
This page allows users to select the category of KPIs they want to view, enabling them to analyze specific indicators with a single click. Once selected, visuals showing their values and comparisons with previous amounts will be displayed, allowing users to identify trends or patterns of interest.
Additionally, for each selected ratio, the corresponding calculation methodology and interpretation based on the current value will be shown.
Furthermore, Finance BI provides access to other data beyond the financial statements, which are detailed in the following section.
If the AI functionality is enabled, the user can access a new page called Anomalies and Predictions through this page. To do so, it is necessary to press the button located at the bottom left corner of the page.